

In last week’s article I provided some commentary on a piece that appeared in the Boston Globe (Sunday 12th March 2023), which implied that a short street in Dorchester was responsible for generating a disproportionate amount of crime i.e., the article reported that in 2022, the police were called to this particular street 132 times. As I pointed out in last week’s article, this resulted in 17 incident reports, indicating that the majority of calls were probably for excessive noise, verbal disputes etc., rather than for serious crimes. However, there were two separate shooting incidents that occurred in 2022, along with a firearm that was either found or confiscated on this street. However, a question remains, and that is one of context i.e., is this street responsible for more crime, including serious crime than those around it? Also is this street the “hub” of a hotspot, or a street amongst others within a hotspot? In this article I want to examine the amount of crime, that occurs within 100 meters of this street, including the nearby Russel Auditorium, and the nearby Talbot Ave rail transit stop. I also want to look at the surrounding street segments to see if the amount of offending on Helen Street, is in fact very different from that of neighboring streets. I am using police incident reports rather than 911 calls to measure this, as these mark events that required a police intervention that was notable.
In a five-year period (2018 to 2022) there were 50 recorded incidents on Helen Street, including 14 separate incidents associated with violent offending e.g., assault and battery, shootings (two events happening almost a year apart), and firearm offenses etc. The street is approximately 120 meters/391 feet in length. The next street over is Kerwin Street, which is approximately 190 meters/624 feet in length. In the same period there were 80 recorded incidents on Kerwin Street, including 12 incidents that would constitute acts of violence. Browning Ave, the next over from Kerwin Street (approx. 787 feet/240 meters long), for the same period, generated 111 incident reports, 17 of which could be classed as violent. A quick “crime density” calculation shows the following; over a 5-year period there were:
- 1. 0.41 total incidents/meter, and 0.12 violent incidents/meter on Helen Street
- 2. 0.42 total incidents/meter, and 0.06 violent incidents/meter on Kerwin Street
- 3. 0.46 total incidents/meter, and 0.07 violent incidents/meter on Browning Ave
Whilst it may at first glance, appear that although there are a few more crime incidents per meter on Kerwin Street, there are twice as many violent incidents on Helen Street, it bears remembering that it only takes a few “extra” events in such a small sample size to significantly skew the data. However, considering the total number of incidents, there are fewer on Helen Street, than on the other two streets. Whilst offending might be slightly more violent on Helen Street, from a total crime perspective Helen Street, looks to be more representative of the immediate area, rather than an exception and an outlier.
Using the same sample size (incidents occurring from 2018 to 2022 inclusive), I looked at two other potential “hubs” for crime and all offenses committed within a 100-meter radius of them, to see if they might well be responsible for generating and attracting crime in the area. These were the Russell Auditorium (located 350 meters/ from Helen Street), and the Talbot Avenue rail transit stop (a 270-meter walk from Helen Street). Within a 100-meter radius of Helen Street, for the five-year period, there were a total of 283 incidents reported (68 of which would be classed as involving some act or threat of violence). Within a 100-meter radius of the Russell Auditorium, there were 154 incidents reported, 14 of which could be classified as violent offenses. When looking at offenses committed within a 100-meter radius of the Talbot Ave rail transit stop, there were a total of 291 incidents reported, 67 of which would be classified as violent offenses.
There are a few things to note about the methodology used in this analysis. It doesn’t consider land use, density and direction, which are three basic things that are needed for such analysis. Land use is important, because not all space is the same regarding crime e.g., if the hub from which a radius is being calculated and analyzed is based right on the edge of an industrial area, fifty percent of the area being studied will be residential and the other half industrial. Also, single industrial units are likely to be much bigger than single residential units e.g., a burglary of a single industrial building, may sit on the same size plot of land as ten residential buildings. From a statistical reporting perspective, comparing a single break-in at an industrial building with three burglaries of residential buildings sitting on the same amount of land, is not a like for like comparison. Linked to this is the population density of an area. More people in an area of land, increases both the number of potential offenders and targets, making offending more likely. Direction is also an important consideration. Things such as major roads, bridges, and rivers affect the direction that both offenders and targets can move in e.g., Talbot Avenue, is a major routeway, that has a park on one side, with the Russell Auditorium on the other, this could mean that 50% of the land looked at in its radius is parkland (land use), and the road cuts it off, making it less accessible from the other side, affecting direction/human flow etc. This could go some way to explaining why its total offenses within a 100-meter radius were around half the number of both Helen Road and Talbot Ave transit stop.
The next step in the analysis was to create a heatmap of crime clusters, of incidents that occurred within one kilometer of Helen Street, to see whether there were “hotter” clusters than that of the incidents committed in and around Helen Street (these clusters measure “groups” of offenses within a 200 meter radius).
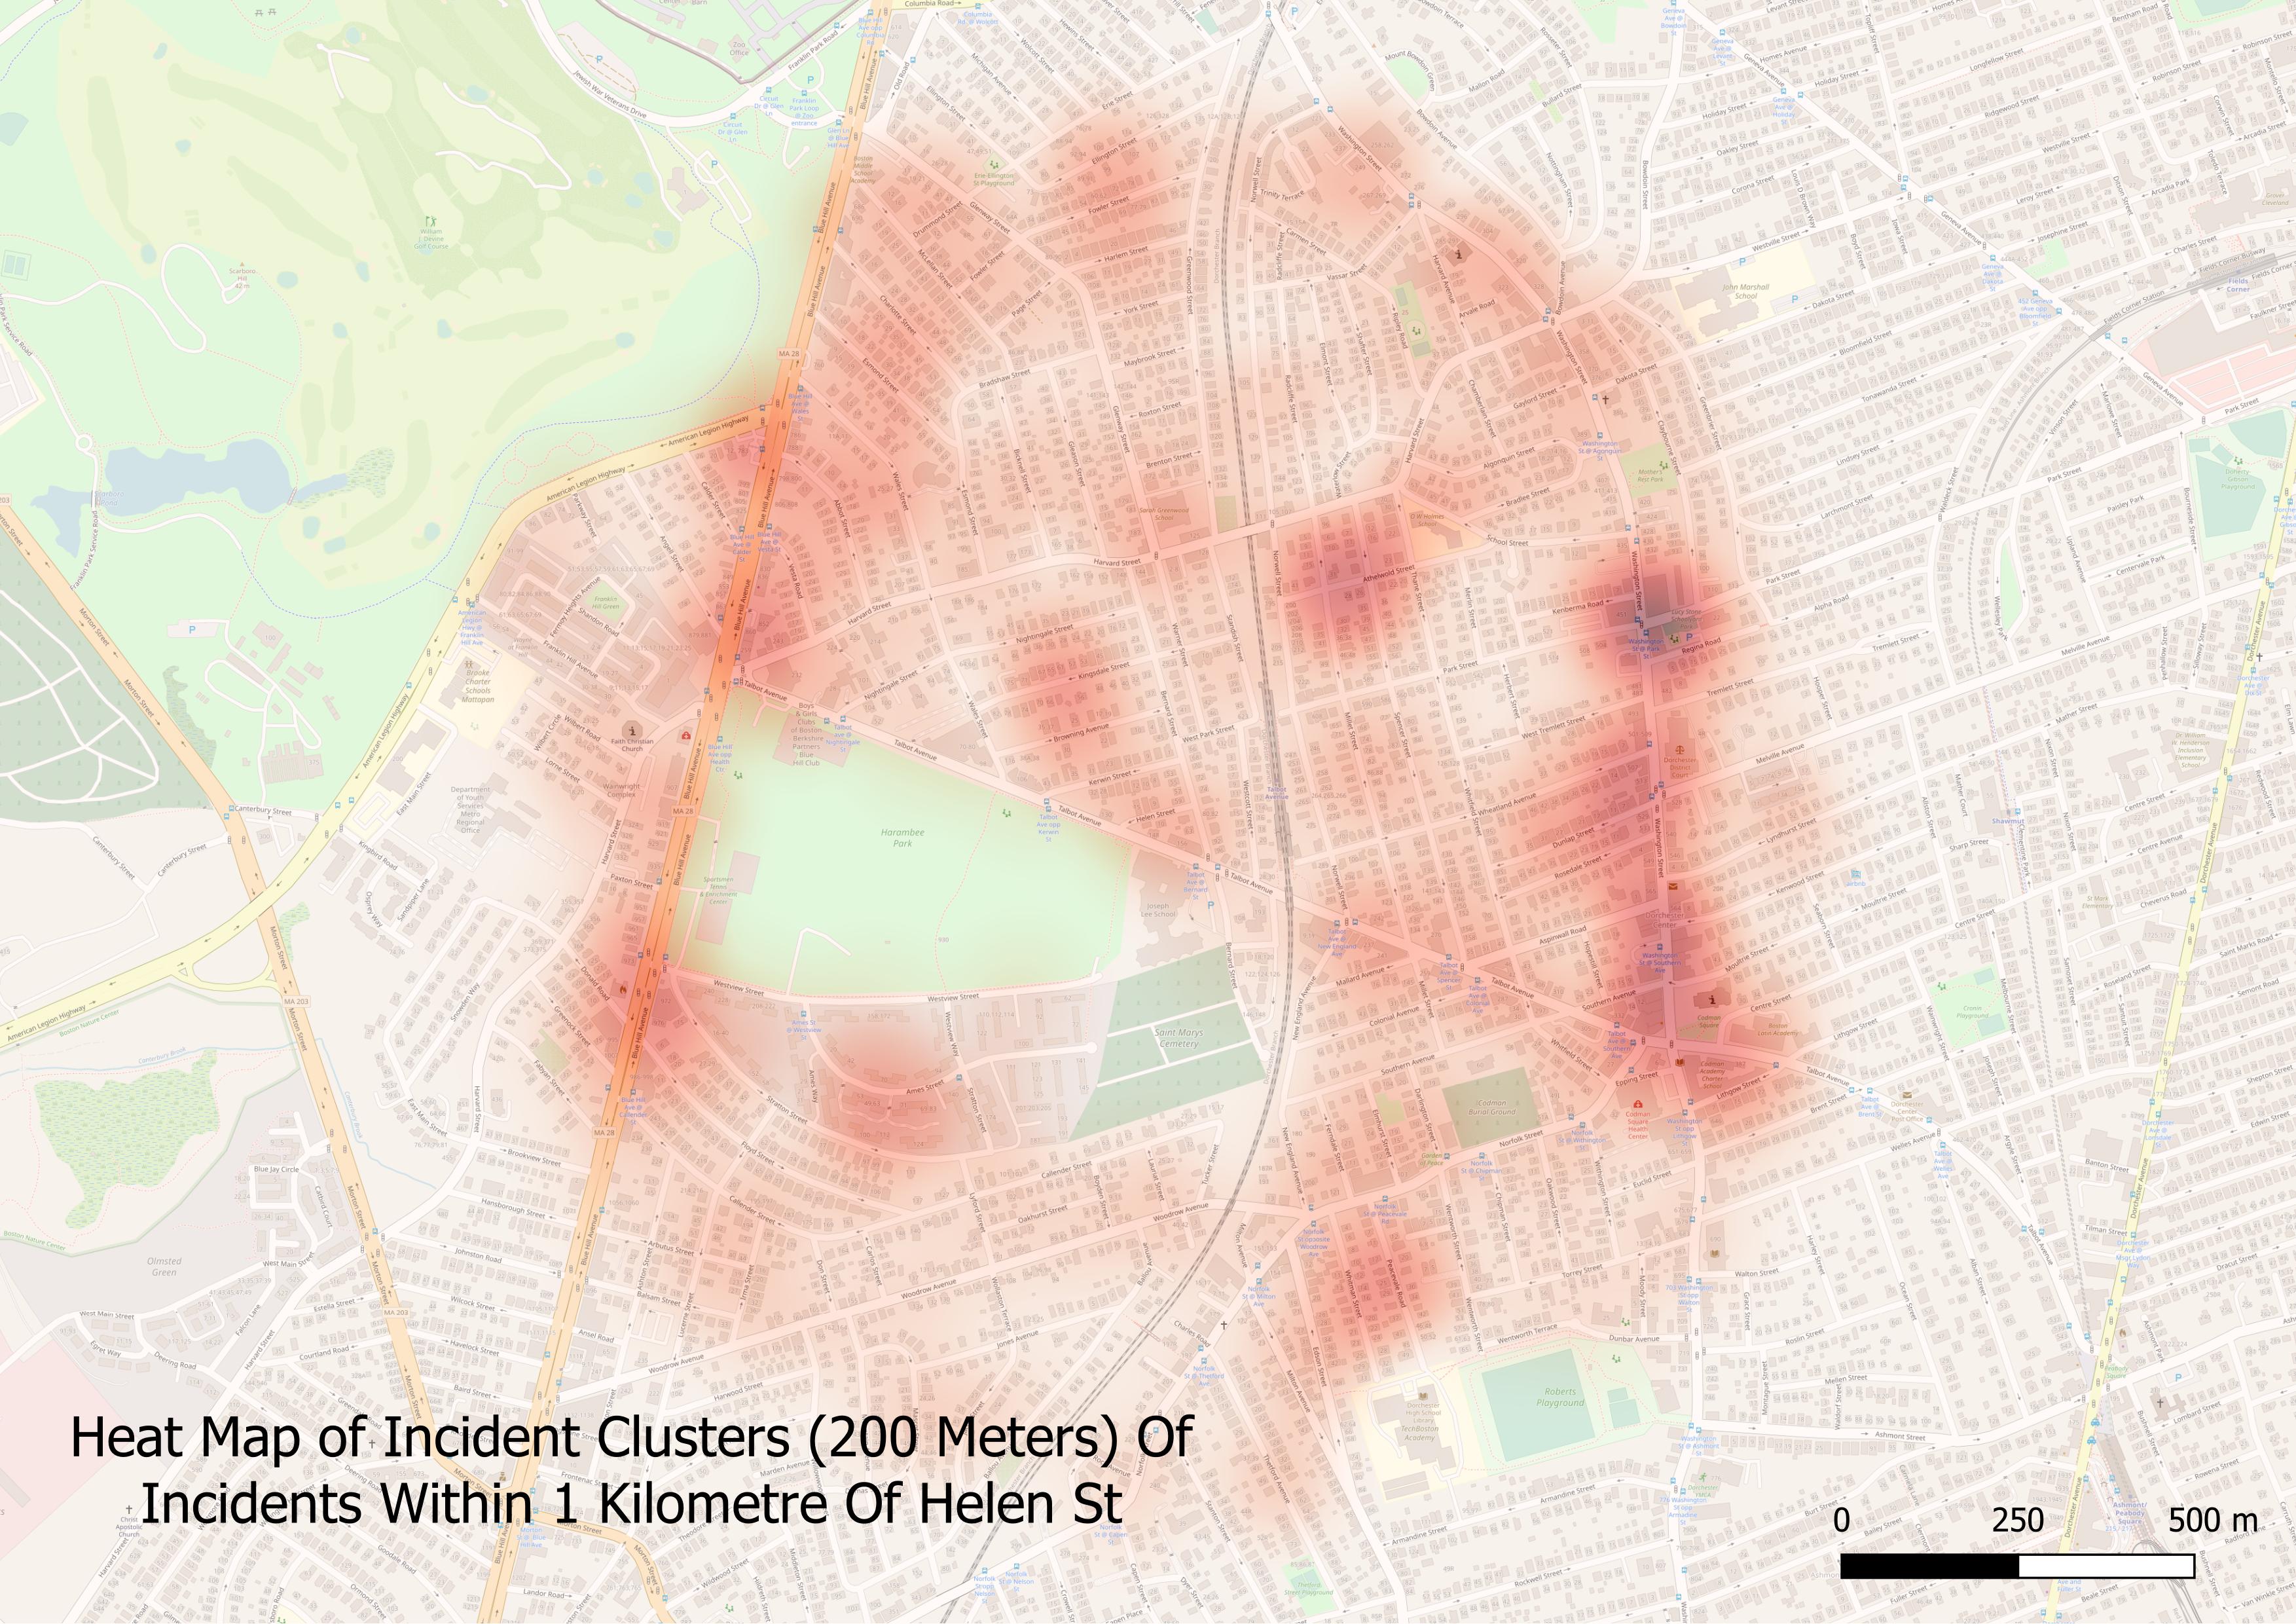
It can be seen that the Helen Street/Kerwin Street/Browning Ave area located North, and to the right of the park - the area just across the road from the park and to the left of the train track - isn’t the most incident/crime-dense location within the area. There is a stretch of dark red hotspots on the far right of the map, that run along a stretch of Washington Road, just North of Talbot Avenue. This stretch of road is a fairly busy routeway, with a number of fast food restaurants, and several bus stops located closely together. Such areas both attract offenders to them, due to the relatively high foot traffic and also generate crime when offenders find themselves in this locale as they go about their routine activities, such as going out to eat etc. This stretch of road appears to have a number of overlapping dense hotspots, that indicate it is a significantly higher crime location than Helen Street and its surrounding streets. From a residential perspective there are two hotpots, one just north and to the west of Helen Street, and another further north and to the east of the rail transit lines which have much higher concentrations of incidents/offenses.
If we look at all incidents within the reporting area, a much greater number of incidents are located south of Helen street.
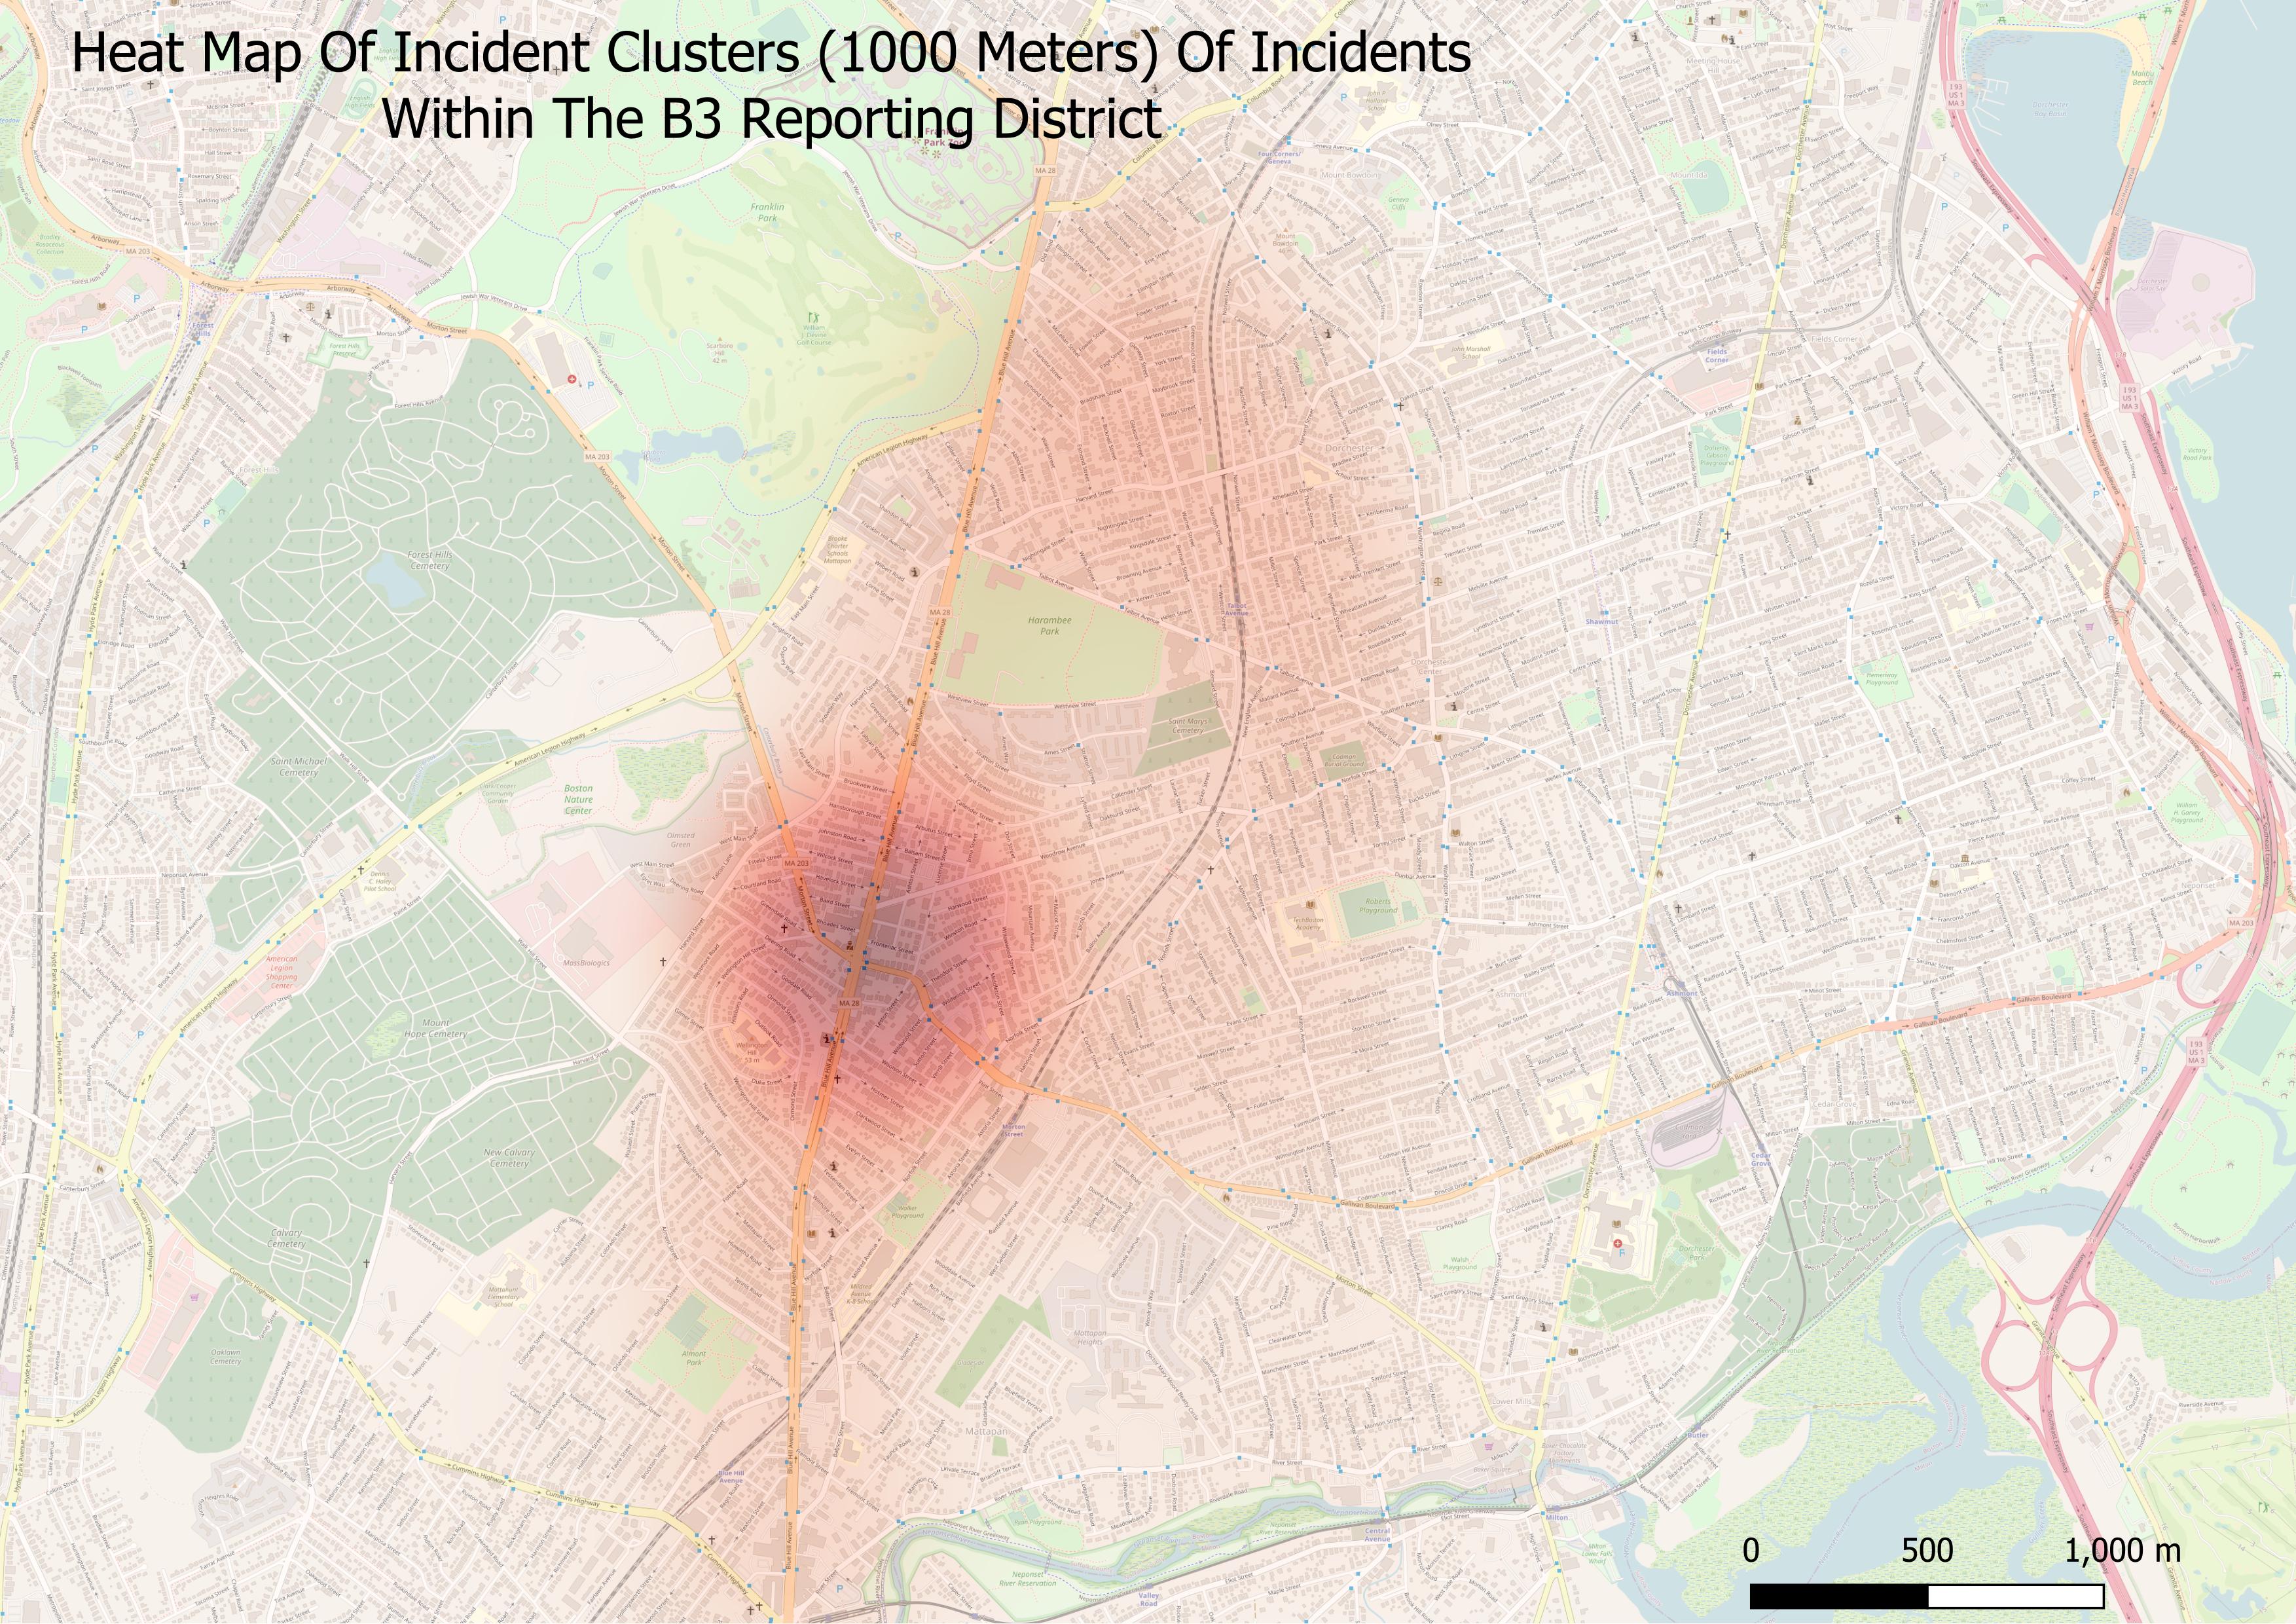
When we extend the range of a cluster to be 1000 meters, we can see that the majority of incidents, occur around the intersection of Blue Hill Avenue and Morton Street. The convergence of two major routeways brings a potentially large number of people, which increases the risk of offending.
At the micro-level, Helen Street may appear to be a high crime location, however when put in context at the meso-level, there are other nearby areas that appear to have higher concentrations of crime, and at the macro-level, it is certainly not the hub. It is all too easy to look at offending in one location, without putting it into any type of context, and lose the true/full picture of what is actually going on.
Share:

Gershon Ben Keren
2.8K FollowersGershon Ben Keren, is a criminologist, security consultant and Krav Maga Instructor (5th Degree Black Belt) who completed his instructor training in Israel. He has written three books on Krav Maga and was a 2010 inductee into the Museum of Israeli Martial Arts.
Click here to learn more.